
Column
What If You Could Actually Converse With Your BI Dashboard? ── TwinBI and the Idea of Analytical Continuity
When an AI remembers what you just did in your BI dashboard and you can pick up the analysis in natural language, exact match accuracy jumps from 43% to 63%. Here's what that means for business intelligence and analytics teams looking to act on this now.
Hi, I’m Keito Inoshita from Affectosphere Group.
Here’s a scenario that might be familiar to BI users.
You’ve just been looking at a regional sales trend on a dashboard. You want to ask: “Now show me the same regions but broken down by product category, just for the ones that grew most versus last month.”
You switch to a chat AI. But the context from what you were looking at on the dashboard doesn’t carry over. You find yourself starting over: “So there’s a sales dashboard, and I’m looking at regional data for this month…” This context reset interrupts your analytical flow.
A study published on arXiv in June 2026 (Jisoo Jang, Wen-Syan Li) addresses this problem directly with a framework called TwinBI.
The bottom line first: TwinBI improved exact match query accuracy from 43.3% to 63.3%, partial match accuracy from 48.3% to 70.8%, and reduced the timeout rate from 40.0% to 10.0%.
3 Points for Today
- The problem: the “context disconnect” between BI dashboards and chat AI breaks analytical continuity.
- How TwinBI works: it synchronizes dashboard operation state with the AI through a unified interaction log.
- Applied use cases: what business planning and analytics teams can try today.
Why BI and AI Don’t Mesh
BI tools (Tableau, Power BI, Looker, etc.) and chat AI (ChatGPT, Copilot, etc.) are both evolving fast. But in most organizations, they live in separate windows.
This disconnect looks like mere inconvenience on the surface. But it directly affects analysis quality.
If you notice a hypothesis while exploring a dashboard and want to ask the AI “given what I’m seeing right now, what do you think?”, the AI doesn’t know what “right now” looks like. The user has to verbalize their entire mental context every time. This cognitive overhead is what prevents deep analytical follow-through.
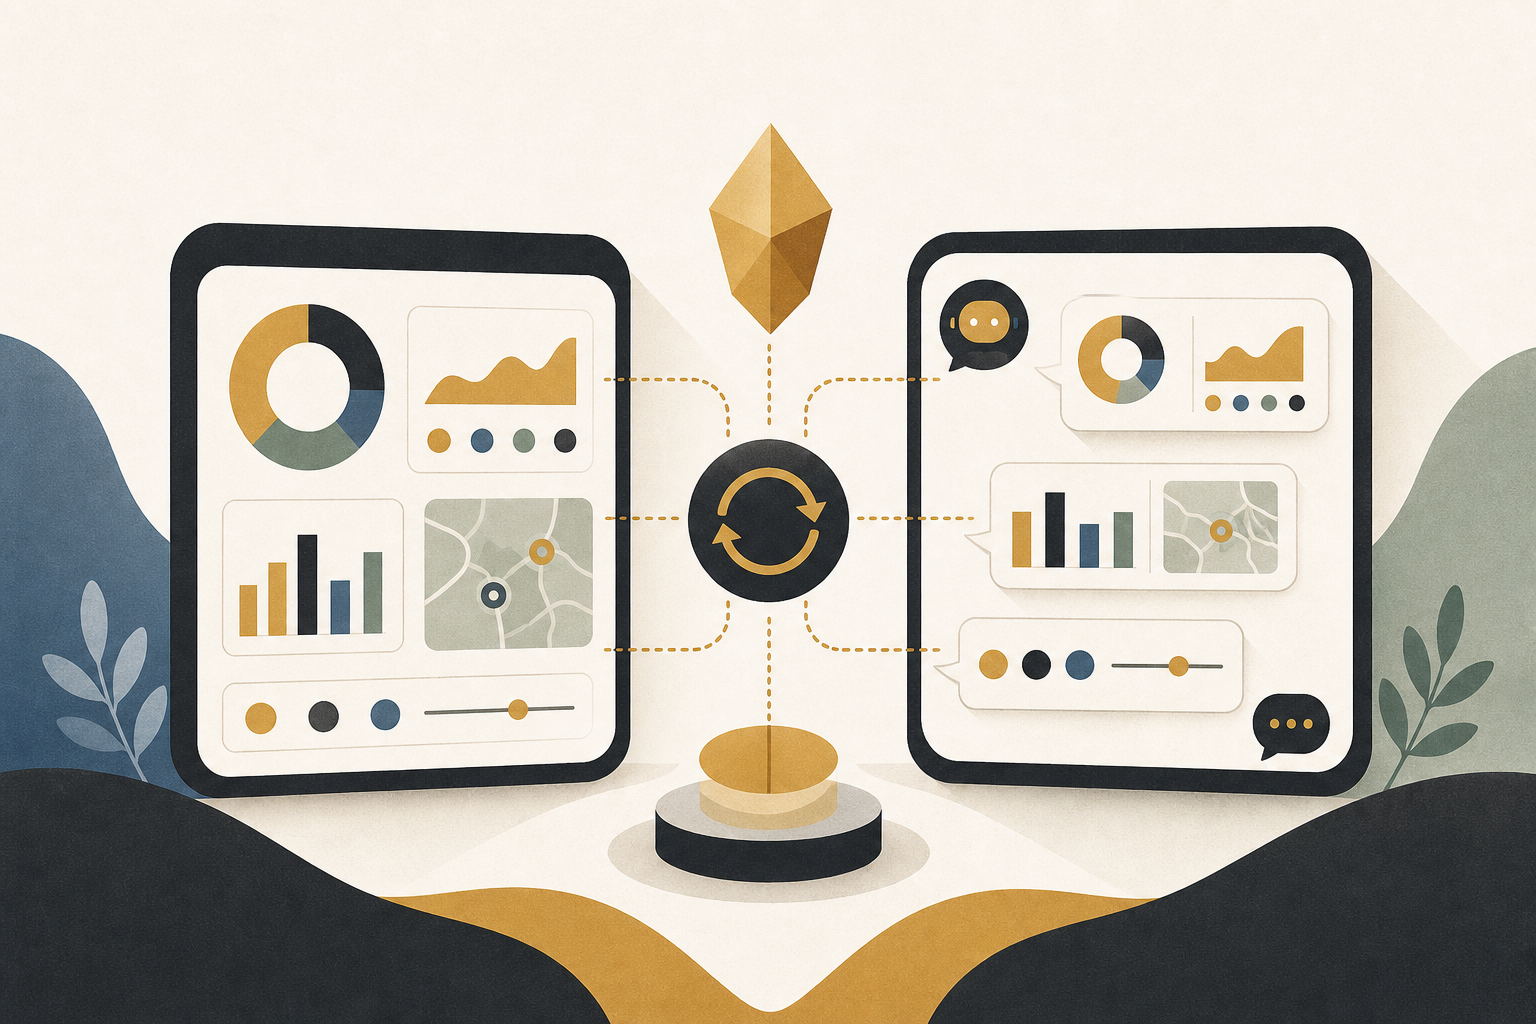
TwinBI addresses this with a design that keeps the dashboard’s operation state and the AI’s state continuously synchronized.
How TwinBI Works ── The “Unified Interaction Log” Concept
The core of TwinBI is a unified interaction log that manages dashboard operations and AI queries in the same place.
Every time a user changes a filter, switches a chart, or adjusts a time range in the dashboard, that operation is recorded in the log. When the AI receives a natural language query, it references the log to understand what the user is currently viewing before generating a response.
The paper exposes three types of artifacts to make this work.
The schema view gives the AI a structured representation of the data model underlying the dashboard. SQL queries pass the current dashboard display state to the AI. Insight generation commands translate natural language instructions into dashboard operation commands.
Combining these three keeps “what’s shown on the dashboard” and “what the AI understands” bidirectionally synchronized.
The Numbers ── What Changed and by How Much
Here’s a summary of the accuracy improvements the paper reports.
Exact match accuracy improved from 43.3% to 63.3%. This measures how often the AI-generated SQL query exactly matched the ground truth query. A roughly 20-point gain seems to clearly reflect the effect of context synchronization.
Partial match accuracy improved from 48.3% to 70.8%. This metric captures cases where the query wasn’t an exact match but still returned substantively correct results.
The timeout rate dropped from 40.0% to 10.0% — a 75% reduction. From a practical standpoint, this may be the most operationally significant number. Reducing the frequency of failed responses from “4 in 10” to “1 in 10” changes the day-to-day experience of using the system.
Usability evaluations also showed strong approval ratings for the state-awareness mechanism specifically. When users feel that “the AI knows what I’m currently looking at,” it generates trust in the system.
Concrete Use Cases to Try First
Reading this research, I found myself thinking about where it maps onto real organizational workflows.
For a monthly business review in a strategy or planning department, consider this scenario: while reviewing monthly KPI dashboards in Tableau or Power BI, a manager asks the AI “which regions look like outliers compared to last month?” With a TwinBI-style setup, the AI would already know the active filters, time range, and metrics being displayed before answering.
In most current environments, “tell me the outliers vs. last month” without context leaves the AI guessing which regions, which metrics, and which time window. Users compensate by typing out that context every time.
For mixed teams — where technical analysts and non-technical managers work together — the value compounds. A data analyst drills down using SQL, and a manager can follow up in natural language: “How does this compare to the same period last year?” Context carries over. No one needs to explain the setup from scratch again.
For IT vendors looking to add AI features to existing BI tools, TwinBI’s architecture is a plausible reference design. Building an interaction log by hooking into existing dashboard operation log APIs seems like a realistic implementation path — without requiring a full platform rebuild.
Can “Analytical Continuity” Become a KPI?
Common KPIs for measuring BI tool adoption include “dashboard utilization rate” and “report generation count.” But how many organizations track “how deeply and continuously an analysis was pursued once it was started”?
What TwinBI points to is a design philosophy of building analytical continuity into the toolchain.
In environments where context resets every time you switch tools, analysis tends to stop at surface-level confirmation. In environments where context persists, “let me look at that next” chains become natural. That chain — from observation to hypothesis to follow-up — is where genuine analytical insight gets generated.
Framing the integration of BI and AI not as “adding a convenient feature” but as “redesigning the analytical process” makes the ROI story much clearer for organizational decision-makers.
That’s all for today!
References
- Jisoo Jang, Wen-Syan Li (2026). TwinBI: An Agentic Digital Twin for Efficient Augmented Interactions with Business Intelligence Dashboards. arXiv preprint.
* This article was written in part with AI assistance and may contain inaccuracies.